ON FREE-SURFACE CHANNEL INSTABILITY
1. INTRODUCTION
Free-surface instability in open-channel flow
is generally manifested by the development of roll waves.
These are unsteady flow features associated with steep, lined channels,
when the Vedernikov number V is greater than or equal to 1
In some circumstances,
roll wave phenomena may be of such magnitude
as to actually place at risk
life and property.
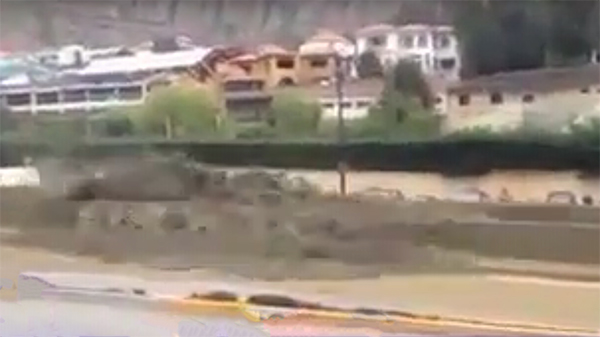
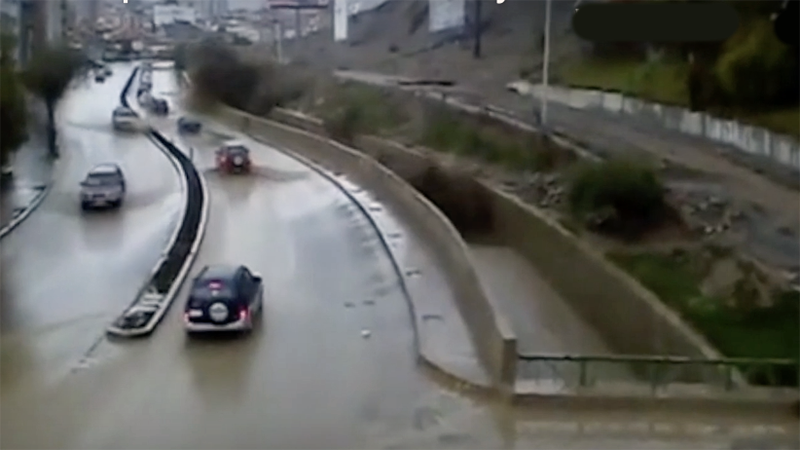
This fact is confirmed by the
roll waves that occur with worrisome regularity in
the Huayñajahuira river, in La Paz, Bolivia, as shown in
We posit that the design of a lined channel for the control of
roll waves may be
accomplished by a judicious choice of cross-sectional shape.
The way to accomplish this is to choose, at the design stage,
a channel shape
that effectively reduces the Vedernikov number below the thresholed value of
1
Herein we use the online calculator
onlinechannel15b,
which determines values of
F, V, and β for a prismatic channel
(Ponce and Boulomytis, 2021). We run the calculator
for a series of cross-sectional shapes,
including trapezoidal and rectangular, keeping constant
the following variables: The aim is to examine the behavior and sensitivity of the flow variables to the Froude F and Vedernikov V numbers, and to the concomitant value of β. In practice, it may be shown that channel stability is attained for values of β close to but clearly greater than 1. Therefore, the optimal cross section, from the standpoint of channel stability, corresponds to the lowest value of β, greater than 1, that is compatible with project cost, optimal footprint dimensions, and other relevant considerations. 2. BACKGROUND
The theory of hydrodynamic stability of open-channel channel flow
is due to Vedernikov (1945).
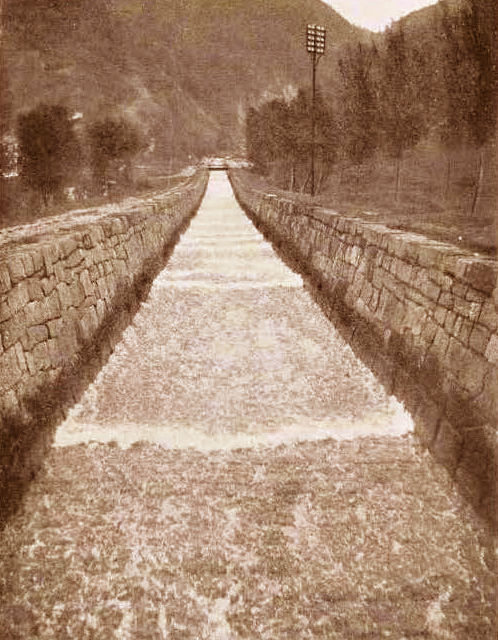
In 1907, Cornish showed, apparently for the first time, a photograph of the fascinating phenomenon
in a paper published in the Journal of the Royal Geographical Society (Fig. 2)
(Cornish, 1907). In 1948, Powell christened the concept, by stating, to wit: "This criterion,
which I am calling the Vedernikov number..."
Fig. 2 Roll waves observed in a canal
in the Swiss Alps
The roles of mass and energy are seen to be central to the development
of roll waves.
While kinematic waves transport mass,
dynamic waves transport energy (Lighthill and Whitham, 1955).
Therefore, the occurrence of roll waves is seen to be related
to the unsteady transport of mass overcoming the unsteady
transport of energy. In this light, roll waves are a curious
physical manifestation of the preponderance of mass transport
over energy transport in unsteady open-channel flow in steep channels
(Ponce and Choque Guzmán, 2019).
3. RELATIONSHIP BETWEEN β AND V/F
There are three characteristic velocities in open-channel hydraulics
(Ponce, 1991):
These three velocities
can only define two independent, dimensionless ratios, or numbers, to wit:
The Froude number is the ratio of the velocity of the normal, steady flow u
to the relative celerity of dynamic waves w:
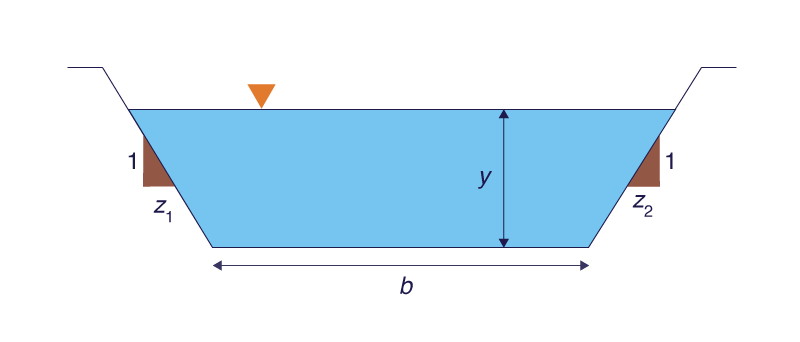
in which D = hydraulic depth (D = A /T ); A = flow area; T =
top width; g = gravitational acceleration (Ponce and Choque Guzmán, 2019;
Ponce and Boulomytis, 2021).
The Vedernikov number is the ratio of the relative celerity of kinematic waves v to the relative celerity of dynamic waves w:
The third ratio, a function of the other two,
is the dimensionless relative kinematic wave celerity v/u,
expressed as follows
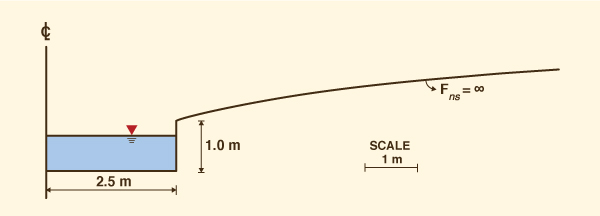
The neutral-stability Froude number Fns is that which
corresponds to the Vedernikov number
Table 1 shows corresponding values of β and Fns for three asymptotic cross-sectional shapes and two types of friction. The shape of the inherently stable channel has been documented. first by Liggett (1975), and later by Ponce and Porras (1995) (Fig. 3).
Equation 4 shows that as More importantly, however, certain cross-sectional shapes featuring values of β close to but greater than 1 result in an actual increase in the value of the neutral stability Froude number Fns, effectively reducing the probability that the flow will become unstable. This line of reasoning is pursued in this paper: To find the optimal shape of cross section, typically trapezoidal, that will show to be both practical and stable. 4. TESTING PROGRAM
4.1 Rationale
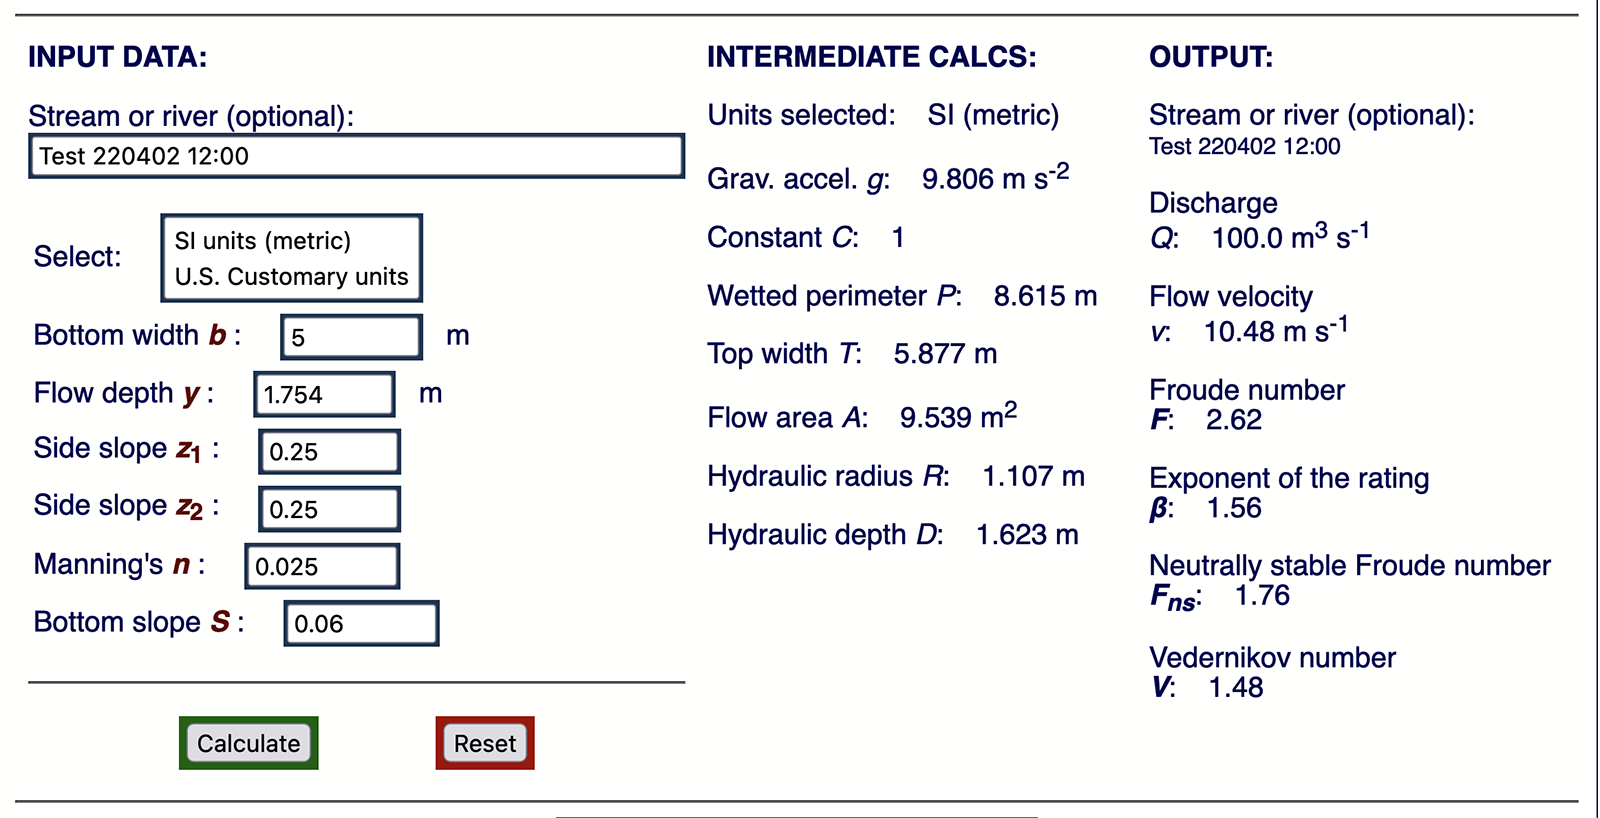
The online calculator onlinechannel15b
calculates the value of β, the exponent of the rating,
corresponding to a rectangular, trapezoidal, or triangular cross-sectional shape.
The calculator requires the following input (Fig. 4):
At the outset, for each design application, determine the applicable values of Manning's n and bottom slope S. The methodology consists of the following steps:
Keeping in mind considerations of flow stability (V < 1) or instability (V ≥ 1), the results are analyzed to choose the optimal design cross-sectional shape compatible with prevailing site and cost constraints.
4.2 Testing program
The testing program is designed to determine the hydraulic conditions in a series of alternative channel cross-sections for which the calculated Vedernikov number varies in the range V ≷ 1. Several values of side slope z are specified, ranging from high (z = 0.25; trapezoidal) to low (z = 0; rectangular), and varying the bottom width b within a suitable range (5 ≥ b ≥ 0). Experience indicates that the chosen range of side slopes (0.25 ≥ z ≥ 0) is likely to provide a desired range of Vedernikov numbers V for appropriate channel flow stability/instability analysis. The following six (6) side slopes are considered in this study:
Tables 2 to 7 show the results of the calculation
using onlinechannel15b.
Generally, when reducing the bottom width b
in the chosen range 5 ≥ b ≥ 1, the smaller the value of
side slope z, the faster the Vedernikov number V
decreases to values less than 1.
Indeed. Table 7 shows that the lowest value of V
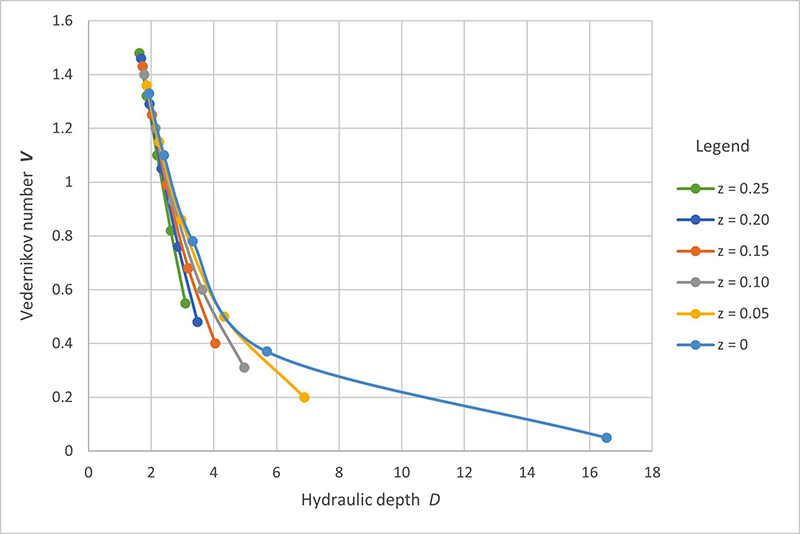
5. ANALYSIS
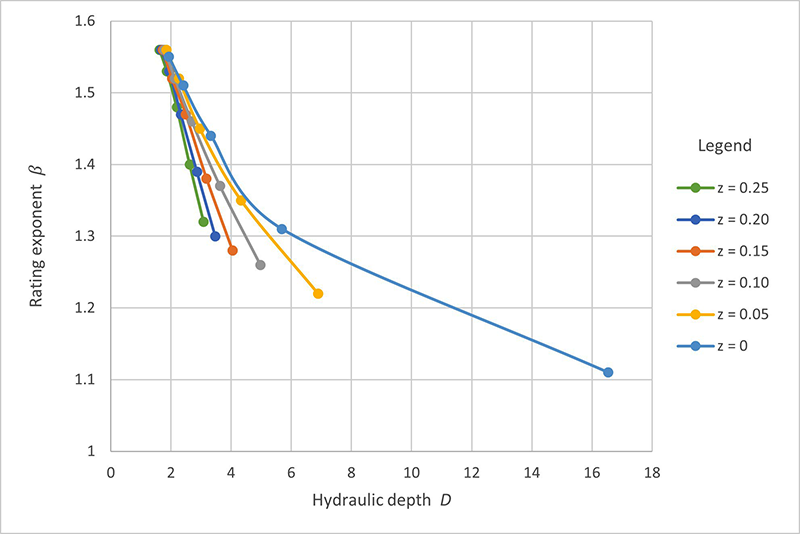
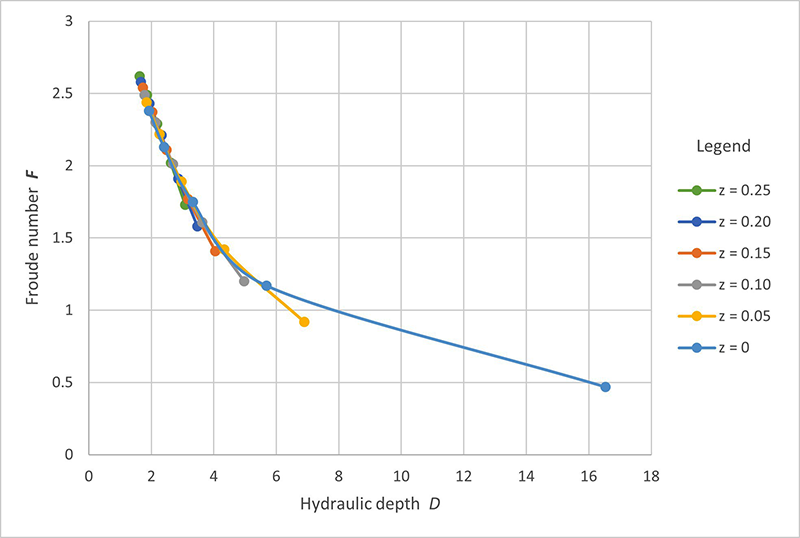
The results of Tables 2 to 7 are analyzed to determine the cross-sectional shape, which in this paper is varied from trapezoidal (z = 0.25; Table 2) to rectangular (z = 0; Table 7), under which the Vedernikov number decreases from the unstable range, V > 1, to the stable range, V ≤ 1. At the outset, it is recognized that the Froude and Vedernikov numbers (Eqs. 1 and 2, respectively) vary inversely with hydraulic depth D. Thus, the larger the value of D, the smaller the values of both Froude and Vedernikov numbers, eventually leading to the condition of stable flow, i.e., V ≤ 1. We pose that herewith is the solution of the stability/instability dichotomy: The larger the hydraulic depth, the more stable is the flow likely to be. To further explain the findings, the variation, with hydraulic depth D, of the rating exponent β, Froude number F, and Vedernikov number V is shown in Figs. 6 to 8, respectively.
Figure 6 shows that the decrease in
β is gradual for the trapezoidal shapes
(0.25 ≥ z ≥ 0.05),
and sharp (to β = 1.11) for the (asymptotic)
rectangular shape It is concluded that the fastest way to decrease the Vedernikov number below 1 and, thus, assure hydrodynamic stability, is to choose a bottom width b, in conjunction with a side slope z, that will assure that V < 1.
In practice, a suitable value of V < 1 may be used
as a design objective. The results of Tables 2 to 6
indicate that, for the example presented herein,
a V = 0.93 is obtained for
b = 3 m and
The analysis presented here purposely
considers only the question of hydrodynamic
stability.
6. CONCLUSIONS
A study of the effect of cross-sectional shape on free-surface channel
hydrodynamic
instability is accomplished. At the outset, the rating exponent β, Froude number
F, and Vedernikov number V are identified
as the controlling variables. The rating exponent characterizes the
discharge-flow area rating Q = α A β.
The Froude number characterizes the flow regime as either: (a) subcritical, (b)
critical, or
A steep, lined channel is specified for the analysis.
The selected design discharge is Q = 100 m3/s, with bottom slope
S = 0.06 and Manning's n = 0.025, closely resembling the flow conditions of the
Huayñajahuira river, in La Paz, Bolivia, where roll waves have been shown
to recur with worrisome regularity.
The online calculator onlinechannel15b
is used to calculate the relevant hydraulic variables, culminating in the
values of rating exponent β, Froude number F, and
Vedernikov number V for each of thirty (5 × 6 = 30) cases.
The results show conclusively that as the channel width b is reduced from
REFERENCES
Craya, A. 1952. The criterion for the possibility of roll wave formation.
Gravity Waves, Circular 521, 141-151, National Institute of Standards and Technology, Gaithersburg, MD.
Cornish, V. 1907.
Progressive waves in rivers. Journal of the Royal Geographical Society, Vol. 29,
Liggett, J. A. 1975. Stability. Chapter 6 in Unsteady Flow in Open Channels,
K. Mahmood and V. Yevjevich, eds., Water Resources Publications, Ft. Collins, Colorado.
Ponce, V. M. 1991. New perspective on the Vedernikov number. Water Resources Research,
Vol. 27, No. 7, 1777-1779, July.
Ponce, V. M., and P. J. Porras. 1995.
Effect of cross-sectional shape on free-surface instability.
Journal of Hydraulic Engineering, ASCE, Vol. 121, No. 4, April, 376-380.
Ponce, V. M. 2014.
Chow, Froude, and Vedernikov. Proceedings,
American Society of Civil Engineers (ASCE)
World Environment and Water Resources Congress, June 1-5, 2014, Portland, Oregon.
Ponce, V. M. and B. Choque Guzmán, 2019.
The control of roll waves in channelized rivers.
http://ponce.sdsu.edu/the_control_of_roll_waves.html
(Cited Aptil 6, 2022).
Ponce, V. M. and V. Boulomytis, 2021.
Design of a stable channel on a steep slope
using the exponent of the rsting.
http://ponce.sdsu.edu/design_of_a_stable_channel_using_the_exponent_of_the_rating.html
(Cited April 6, 2022).
Powell, R. W. 1948. Vedernikov's criterion for ultra-rapid flow. Transactions,
American Geophysical Union, Vol. 29, No. 6, 882-886.
Vedernikov, V. V. 1945. Conditions at the front of a translation wave disturbing a steady
motion of a real fluid, Dokl. Akad. Nauk SSSR, 48(4), 239-242.
| ||||||||||||||||||||||||||||||||||||||||||||||||||||||||||||||||||||||||||||||||||||||||||||||||||||||||||||||||||||||||||||||||||||||||||||||||||||||||||||||||||||||||||||||||||||||||||||||||||||||||||||||||||||||||||||||||||||||||||||||||||||||||||||||||||||||||||||||||||||||||||||||||||||||||||||||||||||||||||||||||||||||||||||||||||||||||||||||||||||||||||||||||||||||||||||||||||||||||||||||||||||||||||||||||||||||||||||||||||||||||||||||||||||||||||||||||||||||||||||||||||||||||||||||||||||||||||||||||||||||||||||||||||||||||||||||||||||||||||||||||||||||||||||||||||||||||||||||||||||||||||||||||||||||||||||||||||||||||||||||||||||||||||||||||||||||||||||||||||||||||||||||||||||||||||||||||||||||||||||||||||||||||||||||||||||
| 220416 06:00 |