Documents in Portable Document Format (PDF) require Adobe Acrobat Reader 5.0 or higher to view;
download Adobe Acrobat Reader.
| Documents in Portable Document Format (PDF) require Adobe Acrobat Reader 5.0 or higher to view; download Adobe Acrobat Reader. |
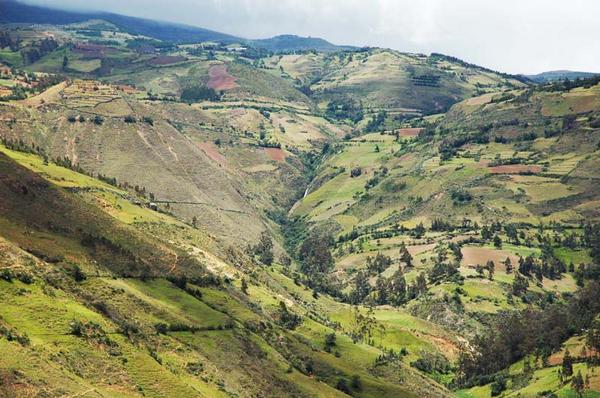 |
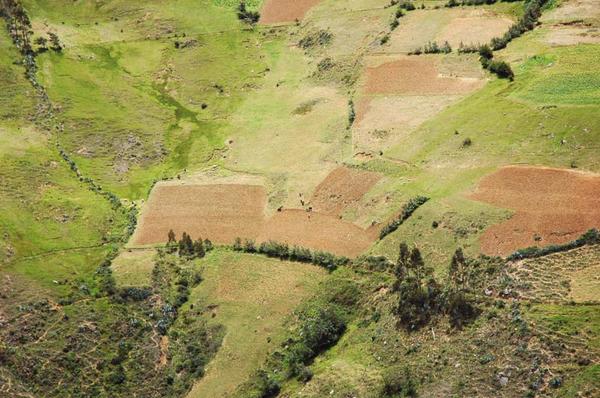
| Fig. 1 Headwaters of the La Leche river basin, near Incahuasi, Lambayeque, Peru. |
LAMBAYEQUE, PERU
FLOOD HYDROLOGY
JULY 2, 2008
2. PROJECT DESCRIPTION
The project encompasses the feasibility design of the structure [or structures] to control floods and store flood waters [for future use] in the La Leche river basin.
Two damsites are currently being considered: (1) La Calzada, and (2) Calicantro (DEPOLTI, 1998). La Calzada is an instream dam, while
Calicantro is an off-stream dam.
| |||||||||||||||||||||||
A dam only at La Calzada would go a long way to store the floods. However, in order to be effective for this purpose, most of the active storage would have to be retarding-pool storage (Fig. 9). Therefore, a dam at La Calzada cannot effectively serve the purpose of storage of flood waters for later use. In addition, a large dam/reservoir at La Calzada would have a tendency to store great quantities of sediment, decreasing the service life of the structure.
A dam only at Calicantro would store great quantities of water for later use. However, it could not serve the purpose of effectively attenuating infrequent La Leche floods. Therefore, a dam at Calicantro will not solve the flood hazard in the La Leche river. A Calicantro dam would not be subject to deposition of great quantities of sediment, increasing the service life, provided the proper exclusion works are in place and are operated effectively.
The solution is to build two dams, one at La Calzada, primarily for flood control, and another at Calicantro, to store water for irrigation and other uses. An added feature of the two-dam strategy is that the useful life of the reservoirs, particularly the one at La Calzada, will be increased. The water will not stay too long in La Calzada, and it could be desilted prior to sending it to Calicantro for storage.
The dam at La Calzada requires a thorough appraisal of the flood hydrology, since it is a major dam located upstream of significant population centers and important infrastructure. The dam at Calicantro has a comparatively large volume and small drainage area; therefore, regional floods should not be a problem, assuring the safety of the dam against overtopping. The spillway would still need to be designed, and its capacity calculated.
The approach is to model the event rainfall-runoff process in the entire La Leche basin, from headwaters to La Calzada. This allows the calculation of flood hydrographs to determine the capacity of principal and emergency spillways, and the [minimum] elevation of the dam crest (freeboard). The principal spillway (PSH), emergency spillway (ESH), and freeboard hydrograph (FBH) are determined for La Calzada. Appropriate design hydrographs for the Calicantro site are also determined.
3. BASIN DESCRIPTION
The basin of the La Leche river, from headwaters to La Calzada, has a drainage area of 907.36 km2.
The basin is located on the western slopes of the Peruvian Western Andes.
The largest town within the basin is Incahuasi, with close to 15,000 inhabitants, including the neighboring rural areas.
The distance from Chiclayo, the closest major population center, to Incahuasi is 120 km.
The time of travel along a winding unpaved road is about 6 hours. Seasonal rainfall can make travel to and from Incahuasi
hazardous and subject to delays.
The headwaters of the La Leche basin are at Cerro Choicopico, at an elevation of 4,230 m above mean sea level.
The La Leche river has two major tributaries,
the Moyán and Sangana rivers.
The hydraulic length of the La Leche river [to La Calzada] along the Moyán tributary, is 44,397 m.
The hydraulic length of the La Leche river along the Sangana tributary is 44,591 m.
Channel slopes vary from as steep as 24% in Quebrada Cascabamba, to 1% near La Calzada.
Mean velocities during infrequent flood events average 4 m/s.
The time of concentration is about 3 hr.
The basin has a mixed land use of impermeable rock, woodlands/grasslands, and croplands.
Average terrain slopes range from 20% to 50%, encouraging surface runoff.
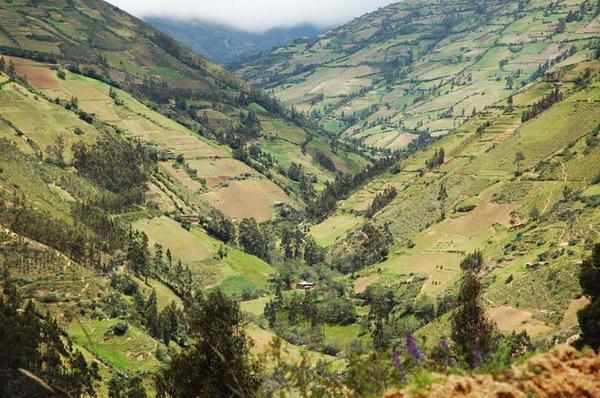
Steep slopes feature exposed rock and very little soil, which discourages infiltration (Fig. 3).
Rainfall varies spatially within
the basin; storms are more intense below elevations of 1500 m (toward the west) and less intense above 1500 m (toward the east).
The climate is semiarid toward the west (near the coast), grading to subhumid toward the east (highlands).
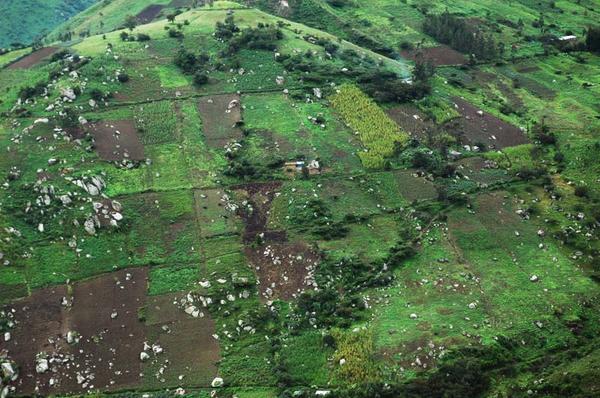 |
| Fig. 3 Rock outcrops and agriculture on steep slopes of La Leche basin. |
There are three climatological stations within the basin's perimeter: (1) Puchaca, (2) Tocmoche, and (3) Incahuasi. Table 2 shows a comparison between these stations. The Puchaca station is at elevation 355 m; the Tocmoche station at 1,450 m; and the Incahuasi station at 3,078 m. The wettest month in Puchaca is December; on the other hand, the wettest month in Tocmoche and Incahuasi is March. Puchaca has less annual rainfall but stronger storm intensities. Incahuasi has more annual rainfall but milder storm intensities. Tocmoche has annual rainfall and storm intensities intermediate between those of Puchaca and Incahuasi. The maximum recorded 24-hr storm in Puchaca is 150.2 mm; in Tocmoche it is 110.0 mm; in Incahuasi, 81.0 mm.
| |||||||||||||||||||||||||||||||||||||||||||||||
4. MODELING STRATEGY
There is a need to determine flood discharges associated with 100-yr to 10,000-yr return periods.
The only streamgaging station, at Puchaca, has records going back to 1963 (Fig. 4).
The maximum flood discharge recorded at Puchaca is 579.75 m3/s.
Geomorphological evidence suggests that long-term flood discharges at La Calzada may have exceeded this value.
The great alluvial plains of the La Leche river could not have been formed without the occurrence of great floods.
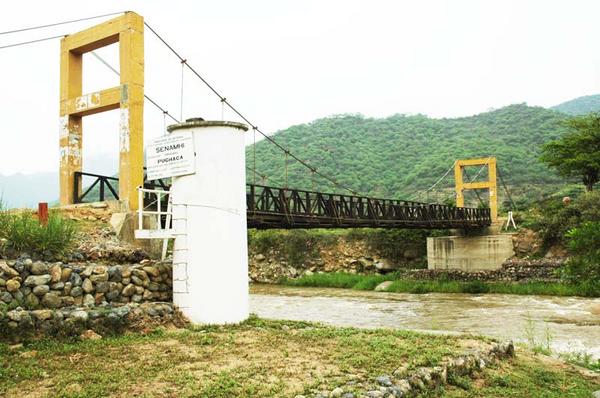 |
| Fig. 4 Gaging station, Rio La Leche at Puchaca. |
For design purposes, when the required return period (in this case, 10,000 years) greatly exceeds the record length (about 40 years),
the analysis must resort to flood determinations based on rainfall-runoff modeling.
In the case of the La Leche basin, maximum design flood discharges are to be expected under a suitable combination of the following conditions:
- Rainfall depth: An El Niño event, likely to recur every 12 to 15 years on the average;
- Spatial coverage: A general storm, covering the entire drainage area; and
- Storm sequence: A major storm following in the heels of another storm, resulting in a wet antecedent moisture condition.
The chosen strategy is to model the flood discharges of the La Leche basin using the deterministic/conceptual rainfall-runoff model RAINFLO©. Event precipitations for 100-yr and 10,000-yr return periods are calculated using the statistical techniques of Log Pearson III and Gumbel. These events are input to the model to calculate flood discharges for the chosen return periods and associated design criteria.
5. MODEL DESCRIPTION
RAINFLO© is
a deterministic/conceptual, distributed, event-driven, rainfall-runoff computational model specifically suited for
the simulation of flood flows (Ponce et al., 1985).
The model calculates design flood hydrographs when presented with suitable storm precipitation
and related geometric, physiographic, soil, hydrologic and hydraulic characteristics of the basin.
The model is deterministic because the stream channel routing component
is calculated with the Muskingum-Cunge method, which simulates the diffusion wave model
(Ponce and Simons, 1977). In this method, the time of travel (K) is based on
Seddon's law (Seddon, 1900), and the weighting factor (X) is based on Hayami's hydraulic diffusivity
and on Cunge's numerical diffusion coefficient (Hayami, 1951; Cunge, 1969).
Moreover, during channel routing, the parameters are allowed to vary with the flow,
resulting in an accurate description of the nonlinear properties of the flood wave and hydrograph
(Ponce and Yevjevich, 1979; Ponce, 1989: p.295).
The routing methodology provides two distinct advantages:
The first advantage enables accurate stream channel routing, whether the streams are gaged or not, and for the full range of
possible flood flows.
The second advantage implies that the calculation is consistent with the governing differential
equations, since the same result is obtained regardless of the grid specification.
The model is conceptual because the hydrologic abstraction component
is calculated with the NRCS runoff curve number method, which simulates the conceptual filling of the soil reservoir
(Ponce and Hawkins, 1996).
Unlike the classical Hortonian approach, which features infinite infiltration depth (bottomless),
in the NRCS method the infiltration depth approaches asymptotically a constant value (the potential maximum retention S) as the storm increases in size
(Horton, 1933; Natural Resources Conservation Service, 1985b).
Experience with the curve number method indicates that it is best suited for infiltration modeling under event conditions.
Its wide global applicability is attributed
to its distinct conceptual basis, although reasonable care is necessary in order to use the method effectively.
The model is distributed because it is able to calculate flood flows, as they vary in space and time
throughout the basin, at any point in the stream network
where an upland subbasin collects its drainage, or where two reach subbasins join together (Fig. 5).
The number of locations where hydrographs can be obtained depends on the basin subdivision.
Typical values for the number of subbasins varies from 10 to 100, with the data needs increasing as the number of subbasins increases
(Ponce et al., 1985;
Ponce et al., 2005).
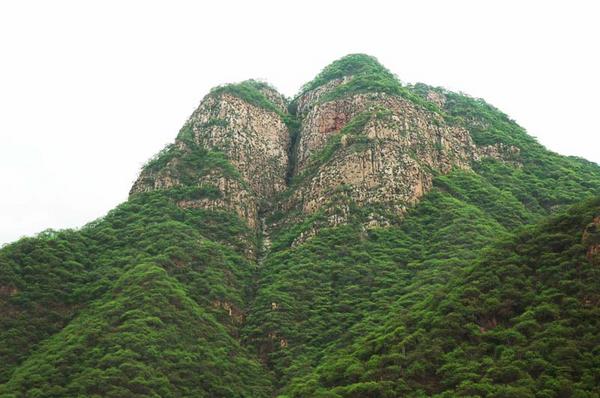 |
| Fig. 5 Lajas de Tongon Mountain, near the confluence of the Moyán and Sangana tributaries. |
The model is event-driven because it simulates flood flows in situations where direct runoff constitutes the majority of the runoff, i.e., where baseflow is small and does not appreciably contribute to the flood peak. Unlike continuous modeling, event-driven modeling does not require long-term moisture accounting. Thus, results of event-driven simulations are consequent with typical variations in parameter ranges. Moreover, the model's unique generalized topological structure enables it to consider a dendritic basin of any order (Fig. 6). Flood hydrographs are seamlessly calculated and expressed at any desired point along the stream network.
The model is a rainfall-runoff model because it seeks, through a suitable transform, to convert effective rainfall (mm) into runoff (m3/s). The transform is accomplished by convoluting the NRCS unit hydrograph with the effective storm pattern, to obtain the flood hydrograph at each subbasin outlet (Natural Resources Conservation Service, 1985b). The applicability of the NRCS unit hydrograph for midsize basins, i.e, those with drainage areas ranging from 1 to 1000 km2 [such as those of the La Leche river] has been thoroughly documented (Ponce, 1989: p.154).
The model is computational because its discretizes the governing equations of mass and momentum conservation (as expressed in the kinematic wave) in the space-time domain by using a suitable numerical scheme, subject to appropriate stability and convergence requirements (Ponce, 1989: p.293). Stability refers to the ability of the scheme to march in time without generating unbounded error growth. Convergence refers to the ability of the scheme to reproduce the terms of the differential equation with sufficient accuracy. The differential equations are expressed in finite difference form, by using space and time intervals (Δx and Δt, respectively). The numerical properties of the model depend on the proper choice of spatial and temporal resolution, i.e., on the Courant number (Ponce and Theurer, 1982; Ponce, 1989). As such, the latter is seen to govern not only the stability but also the convergence of numerical schemes of hyperbolic systems of partial differential equations.
In summary, the RAINFLO© model is based on more than fifty
years of research on hydrologic processes, including abstraction with the NRCS runoff curve number,
rainfall-runoff transform with the NRCS unit hydrograph, and
stream channel routing with the Muskingum-Cunge method. These methodologies have been endorsed, among others,
by the U.S. Army Corps of
Engineers (2000).
6. DATA COLLECTION
The data needs are the following:
6.1 Basin topology
The La Leche basin, from headwaters to La Calzada, is divided into nine (9) upland subbasins and seventeen (17) reach subbasins,
for a total of twenty-six (26) subbasins (Fig. 6).
Runoff in an individual subbasin can be local or imported. Local runoff originates within each subbasin and it is calculated by
convolution of the unit hydrograph.
Imported runoff originates upstream of a reach subbasin and it is routed through the reach using the Muskingum-Cunge method.
Upland subbasins are numbered consecutively [from 1 to 9] in order of increasing topological number of the adjacent reach subbasin.
Reach subbasins are numbered, from upstream to downstream, using a 5-digit order-branch-reach topological number (Fig. 6).
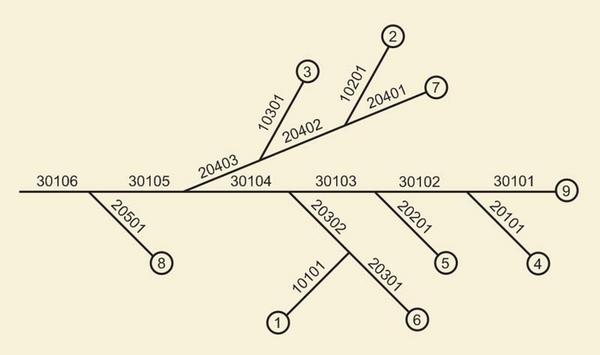 |
| Fig. 6 Topology of the La Leche basin. |
6.2 Geometric properties
The subbasin geometric properties are obtained from 1:100,000 scale topographic maps (Instituto Geográfico Nacional IGN: Incahuasi and Jayanca sheets). The subbasin delineation is shown in Fig. 7. This figure includes the drainage area of the La Leche river to a point downstream of the Calicantro site (Fig. 14). Geographic features are shown in Table 3. Drainage areas for subbasins are delineated following the peaks and saddles of the topography. Hydraulic lengths and channel slopes are obtained from the maps. Hydrologic properties are shown in Table 4. In this table, the last reach subbasin (30106) includes the hydrologic properties only to La Calzada.
The drainage areas vary from 708 ha (Quebrada del Verde) to 8,815 ha (Rio Moyán 3), with an average of 3,490 ha. The total drainage area for the La Leche river at La Calzada is 90,736 ha (907.36 km2). The hydraulic length of the Moyán/La Leche river, from headwaters to proposed damsite is 44,397 m; the hydraulic length of the Sangana/La Leche river is 44,591 m. The average channel slope varies from a high of 0.24 for Quebrada Cascabamba (upland subbasin 6), to a low of 0.01 for Rio La Leche 2, immediately upstream of La Calzada (reach subbasin 30106).
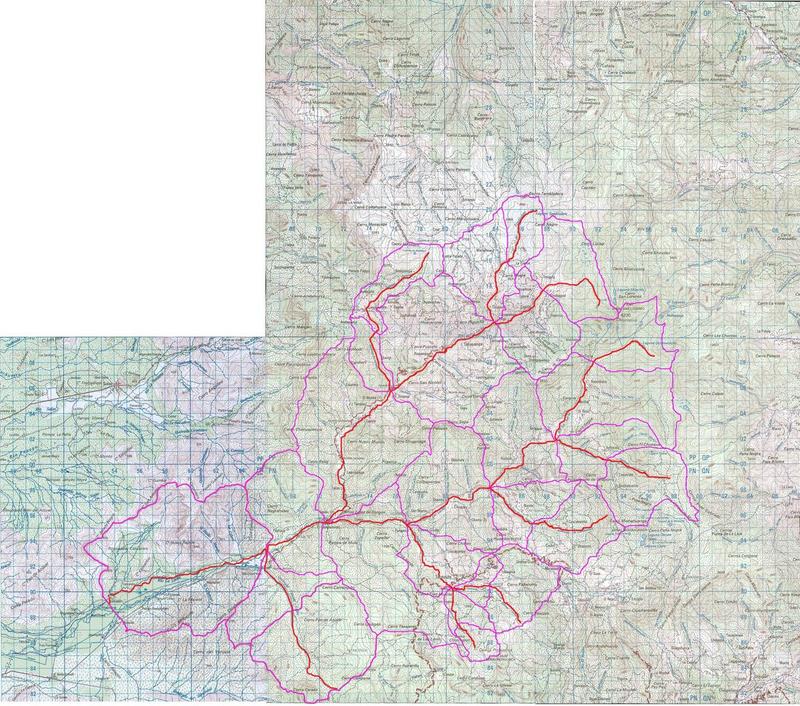 |
| Fig. 7 The La Leche basin, showing stream network in red and subbasin boundaries in purple (Click to enlarge). |
6.3 Terrain slopes
The terrain slopes across the La Leche basin were sampled on a 1-km2 square grid. Average terrain slopes are shown in Table 5. They vary from a low of 19.7% in Quebrada Tembladera to a high of 50.3% in Rio Sangana 2, with an average of 33.7% for the entire La Leche basin to La Calzada (Fig. 8).
 |
| Fig. 8 Typical slopes of the Moyán/La Leche basin. |
6.4 Storm precipitation
The storm precipitation is defined in terms of depth, duration, type, and frequency.
The hydraulic length of the
To choose a suitable type storm, the climatology and geographic features of the La Leche basin are compared with the four regions in the United States for which design type storms have been established. The Type I storm, applicable to Southern and Central Coastal California, an arid/semiarid region in close proximity to the Pacific Ocean, with significant orographic features, is judged to best resemble local/regional conditions in the La Leche basin (Ponce, 1989: p.190).
In the case of the La Leche basin, for which a generalized Probable Maximum Precipitation (PMP) is not available, it is common practice to substitute the 10,000-yr return period for the PMP. Therefore, design storm precipitation for large dams in the La Leche basin is as follows (Natural Resources Conservation Service, 1985a; Ponce, 1989: p.484):
- For the principal spillway hydrograph:
Ppsh = P100
- For the emergency spillway hydrograph:
Pesh = P100 + 0.26 (P10,000 - P100)
Pesh = 0.74 P100 + 0.26 P10,000
- For the freeboard hydrograph:
Pfbh = P10,000
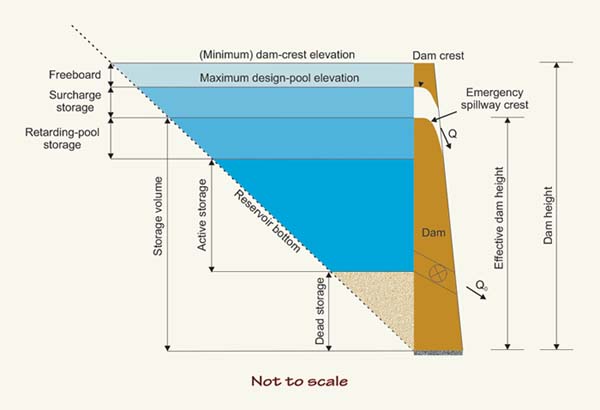
The principal spillway hydrograph is used to determine: (1) the capacity of the principal spillway, (2) the emergency spillway crest elevation, and (3) the volume of retarding pool storage. The emergency spillway hydrograph is used to determine: (1) the capacity of the emergency spillway, (2) the maximum design pool elevation, and (3) the volume of surcharge storage. The freeboard hydrograph is used to determine the minimum dam crest elevation (freeboard), and to evaluate the structural integrity of the spillway system (Fig. 9).
 |
|
Fig. 9 Definition sketch for reservoir storage volumes |
The 24-hr annual maximum storm precipitation records for the Puchaca, Tocmoche, and Incahuasi stations, up to 1998, were obtained from Perez Becerra (2006). The remainder of the record (up to 2002 for Puchaca, and 2007 for Tocmoche and Incahuasi), was obtained from SENAMHI, in Lima, Peru. The ordered values are shown in Table 6.
6.5 Hydrologic soil groups
Consorcio Salzgitter-Lagesa (1984) has estimated the hydrologic soil groups for the La Leche basin as D for the upper basin and B for the middle and lower basins. Perez Becerra (2006) has estimated hydrologic soil groups as varying between B, C, and D, with three types of land uses: (1) impermeable soil or rock, (2) pasture, and (2) shrub.
To estimate hydrologic soil groups for individual subbasins, ground truth measurements of soil texture were performed in-situ during the week of June 9-13, 2008. Twenty-one field tests of soil texture were carried out in suitable locations along the Moyán and Sangana watersheds. Based on these tests, the hydrologic soil groups are estimated as B-C (silty sand and sandy silt) in most sampled locations. The predominant land use across the La Leche basin is mixed impermeable (rock), woodland/grassland and cropland (Fig. 10). The percent aerial coverage and hydrologic surface condition are estimated using GoogleEarth Pro© software. Applicable CN values are given by Ponce (1989), among others.
 |
|
Fig. 10 Mixed land use in the Moyán basin. |
Table 7 shows aerial weighted CN values for each subbasin in the last column. These values are weighted with the respective subbasin drainage areas to obtain a basinwide CN = 80. The values shown in Table 7 are CNII values. For extreme flood conditions, antecedent moisture condition AMCIII is assumed; therefore, the corresponding basinwide CNIII = 91 (Ponce, 1989: p.165).
6.6 Manning's n and cross-sectional geometry
Values of Manning's n shown in Table 8 are estimated based on field inspection, using standard references as guidelines (Chow, 1959; Barnes, 1967). Observational evidence indicates that the tributaries of the La Leche river are able to move very large boulders, with some exceeding 2 m in size (Fig. 18). Accordingly, inbank values of Manning's n for most reaches upstream of the confluence of the Moyán and Sangana rivers are taken as n = 0.08, with two values as high as n = 0.1. Inbank values of Manning's n for the La Leche river proper vary between n = 0.04 and n = 0.06.
Data on typical cross sections was collected in the La Leche, Moyán and Tocmoche basins. Unmeasured cross sections were estimated by similarity, based on stream order, drainage areas, and field experience. Typical reach cross-sectional data is shown in Table 9.
7. STORM FREQUENCY MODELING
Storm frequency modeling was accomplished using the Log Pearson III and Gumbel methods (U.S. Interagency Advisory Committee on Water Data, 1983; Ponce, 1989).
The values shown in Table 6
were used to calculate 100-yr and 10,000-yr 24-hr storms for the three stations: Puchaca, Tocmoche, and Incahuasi.
These values are shown in Table 10, together with the adopted values,
taken as the average of the two methods. Also shown in Table 10 are the
applicable 24-storm precipitation for the principal spillway, emergency spillway, and freeboard hydrographs (Section 6.4).
The 100-yr and 10,000-yr design storm depth vs elevation data [of three stations] of
Table 10 was taken as a
reference set. For each subbasin,
design storm precipitations
were obtained by logarithmic interpolation, based on the elevation of the subbasin's centroid.
The calculated design storm precipitations are shown in Table 11.
Weighing the storm precipitations with the respective drainage areas leads to
the basinwide storm precipitations shown in the last row of Table 11.
8. MODEL RESULTS
The calculated design storm precipitations
are used to drive the RAINFLO© model to simulate the design flood hydrographs.
The subbasin curve numbers are shown in Table 7.
Wet antecedent moisture condition (AMCIII) is assumed in all cases.
The rainfall-runoff transform [NRCS unit hydrograph] is performed using the data of Table 4
and Table 5.
The frictional and cross-sectional data is shown in Table 8
and Table 9.
The model was run for a period of 48 hr using a [computational] time interval of 7.5 minutes.
The Courant numbers were kept close to C = 1 to
preserve the accuracy of the routing method (Ponce and Theurer, 1982;
Ponce, 1989: p.293). Flood hydrographs were routed through the stream channels using the
Variable-Parameter Muskingum-Cunge (VPMC) method
(Ponce and Yevjevich, 1979).
This computational feature assures that the nonlinear properties of the hydrograph are preserved, i.e., that
the celerity and diffusivity characteristics
of the flood wave vary as a function of the prevailing discharge.
Applicable design flood hydrographs are shown in Figs. 11, 12, and 13.
A summary of design flood discharges is shown in Table 12.
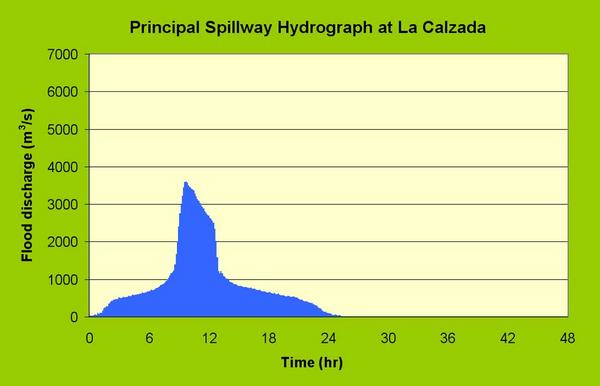 |
| Fig. 11 Principal spillway hydrograph at La Calzada. |
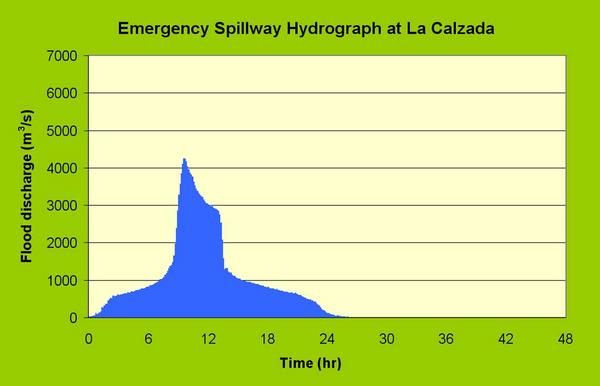 |
| Fig. 12 Emergency spillway hydrograph at La Calzada. |
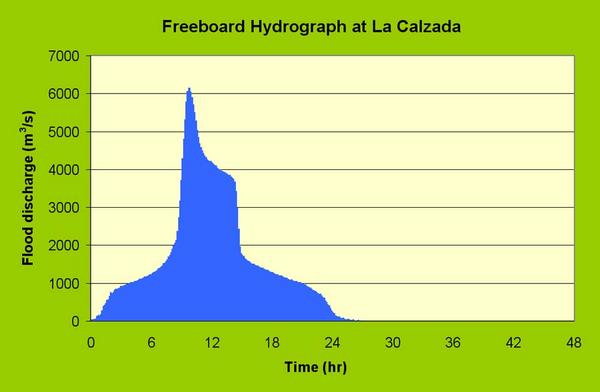 |
| Fig. 13 Freeboard hydrograph at La Calzada. |
| Table 12. Design flood discharges for dam at La Calzada. | |||||
| Hydrograph | Flood peak discharge (m3/s) | Hydrograph volume (hm3) | Area-weighted 24-hr storm depth (mm) | Storm volume (hm3) | Runoff (%) |
| Principal spillway hydrograph | 3,608 | 86.6 | 121 | 109.8 | 0.79 |
| Emergency spillway hydrograph | 4,244 | 107.4 | 145 | 131.6 | 0.82 |
| Freeboard hydrograph | 6,147 | 166.5 | 213 | 193.3 | 0.86 |
The initial peak shown in Figs. 11 to 13 reflects the early contribution of Quebrada Cincate (Colán) (topological number 20501, Fig. 6), which is located close to the damsite at La Calzada. The steepness of the calculated flood hydrographs reflects the nonlinear mode of calculation, in which the routing parameters are a function of the prevailing discharge.
The major tributaries of the La Leche river at La Calzada are: (1) Moyan river, (2) Sangana River, and (3) Cincate Creek.
Based on the principal spillway hydrograph (100-yr flood),
these tributaries contribute the following volumes to the flood peak at La Calzada: (1) Moyan River: 27.3%,
(2) Sangana River: 43.6%, (3) Cincate Creek: 16.6%, for a total of 87.5%. The remaining volume (12.5%)
is contributed by the La Leche River between the Moyan-Sangana and Cincate Creek confluences (7.8%),
and the La Leche River between the Cincate Creek confluence and La Calzada (4.7%).
9. DAM AT CALICANTRO
An assessment was performed of design hydrographs for a proposed dam and reservoir at Calicantro.
The basin delineation is shown in Fig. 14. The dam axis is approximately located where there is an ancient wall, labeled
"Muro" in Rinconada Calicantro (Fig. 14). The RAINFLO© model was used to calculate design discharges.
Two subbasins were considered: an upland subbasin [1], upstream of La Tranca, and a reach subbasin [10101], in Rinconada Calicantro proper (Quebrada Huerequeque).
A field inspection on June 13, 2008, confirmed that Quebrada Huerequeque, which drains Rinconada Calicantro,
has sizable dimensions and substantial flood flows.
The data collection and modeling at Calicantro resembled those used at La Calzada (Section 6).
A summary of the Calicantro data is shown in Table 13 (hydrologic properties),
Table 14 (runoff curve numbers),
Table 15 (Manning's n),
Table 16 (cross-sectional data), and
Table 17 (design storm precipitation).
Design flood hydrographs are shown in Figs. 15, 16, and 17.
A summary of design flood discharges is shown in Table 18.
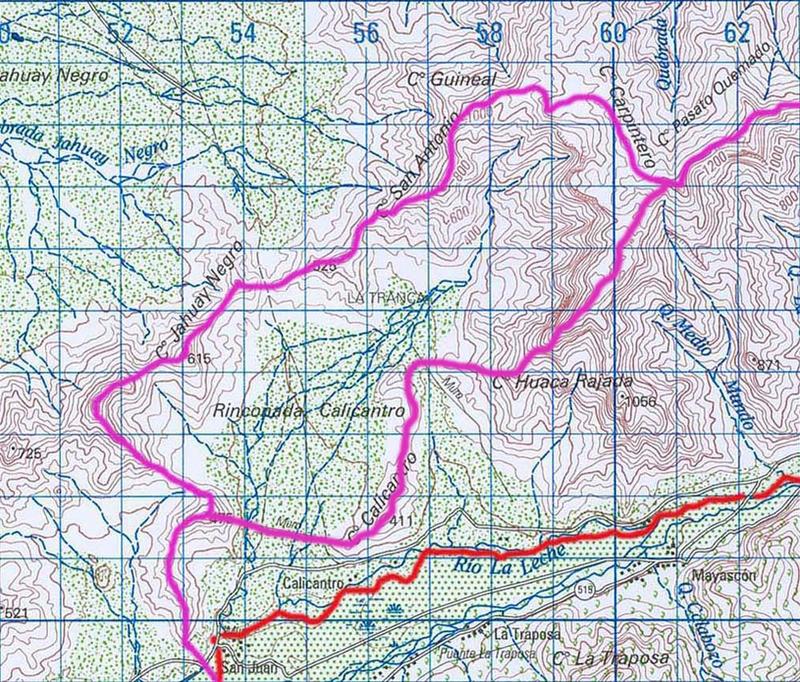 |
| Fig. 14 Basin delineation for Calicantro dam. |
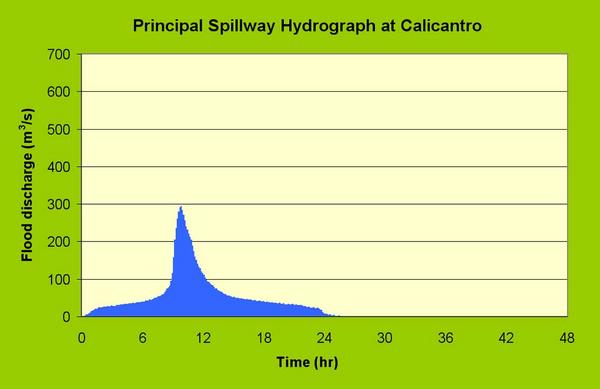 |
| Fig. 15 Principal spillway hydrograph at Calicantro. |
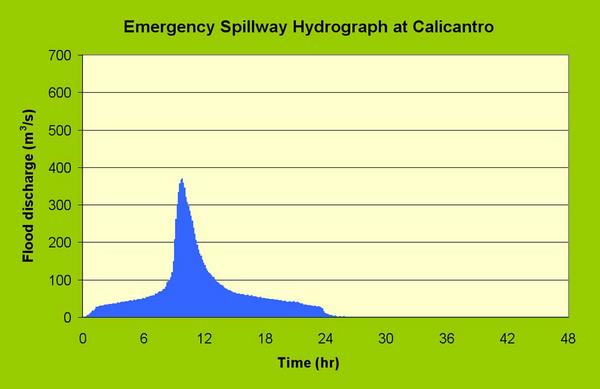 |
| Fig. 16 Emergency spillway hydrograph at Calicantro. |
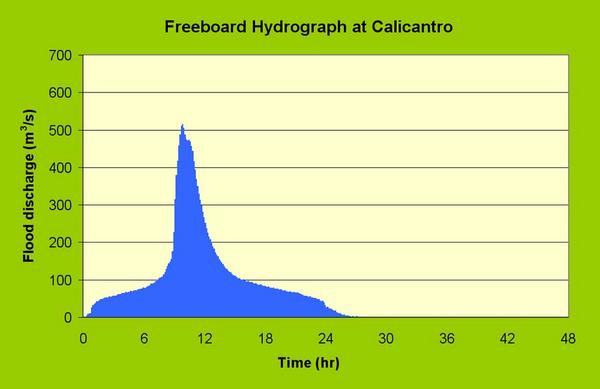 |
| Fig. 17 Freeboard hydrograph at Calicantro. |
| Table 18. Design flood discharges for dam at Calicantro. | |||||
| Hydrograph | Flood peak discharge (m3/s) | Hydrograph volume (hm3) | Area-weighted 24-hr storm depth (mm) | Storm volume (hm3) | Runoff (%) |
| Principal spillway hydrograph | 294 | 5.33 | 203 | 5.96 | 0.89 |
| Emergency spillway hydrograph | 370 | 6.81 | 253 | 7.43 | 0.92 |
| Freeboard hydrograph | 516 | 11.03 | 397 | 11.66 | 0.95 |
10. CONCLUSIONS
The deterministic/conceptual distributed rainfall-runoff model RAINFLO© is used to calculate design flood discharges for a proposed
instream dam in the La Leche river at La Calzada, in Lambayeque, Peru (Section 8).
Calculations for a proposed off-stream dam at a neighboring site at Calicantro are also performed (Section 9).
The model is driven by suitable frecuency-based
24-hr storms which take into account the precipitation record,
including El Niño events. These meteorological events, which recur every 12 to 15 years,
produce unusually large amounts of precipitation.
The resulting floods threaten the existing human settlement in the lower La Leche river basin.
Geometric, physiographic, soil, hydrologic, and hydraulic frictional and cross-sectional data are assembled in suitable form
in order to drive the computational model.
Design hydrographs, peak flood discharge, hydrograph volume, storm volume, and percent runoff are calculated for
principal spillway, emergency spillway, and freeboard hydrographs (Tables 12 and 18). These design hydrographs are used to size the
retarding-pool storage, surcharge storage, and freeboard (Fig. 9).
REFERENCES
Barnes, H. A. 1967. Roughness characteristics of natural channels.
U.S. Geological Survey Water-Supply Paper 1849, Washington, D.C.
Chow, V. T. Open-channel hydraulics. McGraw-Hill, New York.
Consorcio Salzgitter-Lagesa, 1984. Rehabilitación y reconstrucción de los sistemas de riego y drenaje del valle
Chancay-Lambayeque: Estudio de evacuación de avenidas extraordinarias a nivel de factibilidad técnica.
Tomo 1: Resumen e investigaciones básicas, marzo.
Cunge, J. A., 1969. On the subject of a flood propagation computation method (Muskingum method). Journal of Hydraulic Research, Vol. 7, No. 2, 205-230.
DEPOLTI (Dirección Ejecutiva del Proyecto Especial Olmos-Tinajones), 1998.
Actualización de la factibilidad tecnico-económica del embalse en el Río
La Leche, Chiclayo, Peru, 339 p.
Hayami, S., 1951. On the propagation of flood waves. Disaster Prevention Research Institute, Kyoto University, Bulletin No. 1, December.
Horton, R, E., 1933. The role of infiltration in the hydrologic cycle. Transactions, American Geophysical Union, Vol. 14, 446-460.
Natural Resources Conservation Service, 1985a.
Earth dams and reservoirs.
Technical Release No. 60 (TR-60), revised October.
Natural Resources Conservation Service, 1985b. National Engineering Handbook, Section No. 4 - Hydrology, Washington, D.C.
Perez Becerra, M. A., 2006. Estudio hidrológico e hidráulico
en el río La Leche: Generación de las descargas y niveles máximos por avenidas
en la zona del proyecto "Puente Colgante Pítipo." Proyecto Especial Olmos-Tinajones, Gerencia de Desarrollo Tinajones, Mayo.
Ponce, V. M., and D. B. Simons, 1977. Shallow wave propagation in open channel flow.
ASCE Journal of Hydraulic Engineering, Vol. 103, No. 12, December.
Ponce, V. M., and V. Yevjevich, 1979. Muskingum-Cunge method with variable parameters.
ASCE Journal of Hydraulic Engineering, Vol. 103, No. 12, December.
Ponce, V. M., and F. D. Theurer, 1982. Accuracy criteria in diffusion routing. ASCE
Journal of Hydraulic Engineering, Vol. 108, No. 6, June.
Ponce, V. M., 1985. Large basin deterministic hydrology: A case study.
ASCE Journal of Hydraulic Engineering, Vol. 111, No. 9, September.
Ponce, V. M., 1989. Engineering Hydrology, Principles and Practices. Prentice Hall, Englewood Cliffs, New Jersey.
Ponce, V. M., and R. H. Hawkins, 1996. Runoff curve number: Has it reached maturity?
ASCE Journal of Hydrologic Engineering, Vol. 1, No. 1, January.
Ponce, V. M., H. A. Castro, A. E. Espinoza, R. Celis, and F. Perez. 2005.
Flood hydrology of Tecate Creek, Tecate, Baja California, Mexico.
Web report.
Seddon, J. A., 1900. River hydraulics. ASCE Transactions, Vol. XLIII, 179-243, June.
U.S. Army Corps of Engineers, 2000. Hydrologic modeling system HEC-HMS, Technical Reference Manual, March.
U.S. Interagency Advisory Committee on Water Data, 1983. Guidelines for determining flood flow frequency. Hydrology Subcommitee, Bulletin
No. 17B, issued 1981, revised 1983, Reston, Virginia.
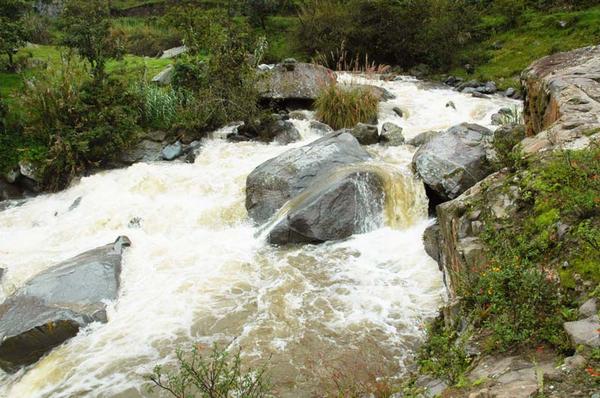
Fig. 18 The Moyán river near Tingo [20401], showing large-sized boulders on the streambed.